Machine Learning
By Tainá Carreira da Rocha
24/8/2022
The final report of Machine Learning course from curso-r company is a prediction about who will purchase at Google Virtual Store in the next month.
Packages
library(tidymodels)
## ── Attaching packages ────────────────────────────────────── tidymodels 1.0.0 ──
## ✔ broom        1.0.0     ✔ recipes      1.0.1
## ✔ dials        1.0.0     ✔ rsample      1.1.0
## ✔ dplyr        1.0.9     ✔ tibble       3.1.8
## ✔ ggplot2      3.3.6     ✔ tidyr        1.2.0
## ✔ infer        1.0.2     ✔ tune         1.0.0
## ✔ modeldata    1.0.0     ✔ workflows    1.0.0
## ✔ parsnip      1.0.1     ✔ workflowsets 1.0.0
## ✔ purrr        0.3.4     ✔ yardstick    1.0.0
## ── Conflicts ───────────────────────────────────────── tidymodels_conflicts() ──
## ✖ purrr::discard() masks scales::discard()
## ✖ dplyr::filter()  masks stats::filter()
## ✖ dplyr::lag()     masks stats::lag()
## ✖ recipes::step()  masks stats::step()
## • Learn how to get started at https://www.tidymodels.org/start/
library(tidyverse)
## ── Attaching packages ─────────────────────────────────────── tidyverse 1.3.1 ──
## ✔ readr   2.1.2     ✔ forcats 0.5.1
## ✔ stringr 1.4.0
## ── Conflicts ────────────────────────────────────────── tidyverse_conflicts() ──
## ✖ readr::col_factor() masks scales::col_factor()
## ✖ purrr::discard()    masks scales::discard()
## ✖ dplyr::filter()     masks stats::filter()
## ✖ stringr::fixed()    masks recipes::fixed()
## ✖ dplyr::lag()        masks stats::lag()
## ✖ readr::spec()       masks yardstick::spec()
library(rpart)
##
## Attaching package: 'rpart'
## The following object is masked from 'package:dials':
##
##     prune
library(rpart.plot)
library(pROC)
## Type 'citation("pROC")' for a citation.
##
## Attaching package: 'pROC'
## The following objects are masked from 'package:stats':
##
##     cov, smooth, var
library(vip)
##
## Attaching package: 'vip'
## The following object is masked from 'package:utils':
##
##     vi
Read the data
ga = readr::read_csv("data/ga_train.csv")
## Rows: 1061278 Columns: 38
## ── Column specification ────────────────────────────────────────────────────────
## Delimiter: ","
## chr  (15): fullVisitorId, last_channel_grouping, last_browser, last_deviceCa...
## dbl  (22): last_ses_from_the_period_end, interval_dates, unique_date_num, ma...
## date  (1): month
##
## ℹ Use `spec()` to retrieve the full column specification for this data.
## ℹ Specify the column types or set `show_col_types = FALSE` to quiet this message.
glimpse(ga)
## Rows: 1,061,278
## Columns: 38
## $ month                        <date> 2016-09-01, 2016-09-01, 2016-09-01, 2016…
## $ fullVisitorId                <chr> "000005103959234087", "000011415654313568…
## $ last_channel_grouping        <chr> "Organic Search", "Social", "Social", "So…
## $ last_ses_from_the_period_end <dbl> 11, 24, 23, 12, 5, 15, 7, 17, 13, 6, 17, …
## $ interval_dates               <dbl> 0, 0, 0, 0, 0, 0, 4, 0, 0, 0, 0, 0, 0, 0,…
## $ unique_date_num              <dbl> 1, 1, 1, 1, 1, 1, 2, 1, 1, 1, 1, 1, 1, 1,…
## $ max_visit_num                <dbl> 1, 1, 1, 1, 1, 1, 3, 1, 1, 1, 1, 1, 1, 5,…
## $ last_browser                 <chr> "Chrome", "Safari", "Opera Mini", "Chrome…
## $ last_deviceCategory          <chr> "mobile", "desktop", "mobile", "desktop",…
## $ last_continent               <chr> "Americas", "Asia", "Africa", "Asia", "Eu…
## $ last_operatingSystem         <chr> "Android", "Macintosh", "(not set)", "Win…
## $ last_subContinent            <chr> "Northern America", "Western Asia", "Nort…
## $ last_country                 <chr> "United States", "Turkey", "Sudan", "Phil…
## $ last_region                  <chr> "not available in demo dataset", "Istanbu…
## $ last_metro                   <chr> "not available in demo dataset", "(not se…
## $ last_city                    <chr> "not available in demo dataset", "Istanbu…
## $ last_networkDomain           <chr> "comcast.net", "ttnet.com.tr", "opera-min…
## $ last_source                  <chr> "google", "youtube.com", "youtube.com", "…
## $ last_medium                  <chr> "organic", "referral", "referral", "refer…
## $ prop_isMobile                <dbl> 1, 1, 1, 1, 1, 1, 1, 1, 1, 1, 1, 1, 1, 1,…
## $ prop_isTrueDirect            <dbl> 0.0, 0.0, 0.0, 0.0, 0.0, 0.0, 1.0, 0.0, 0…
## $ sum_hits                     <dbl> 10, 1, 1, 1, 1, 2, 2, 3, 2, 1, 2, 4, 46, …
## $ mean_hits                    <dbl> 10.0, 1.0, 1.0, 1.0, 1.0, 2.0, 1.0, 3.0, …
## $ min_hits                     <dbl> 10, 1, 1, 1, 1, 2, 1, 3, 2, 1, 2, 4, 46, …
## $ max_hits                     <dbl> 10, 1, 1, 1, 1, 2, 1, 3, 2, 1, 2, 4, 46, …
## $ median_hits                  <dbl> 10.0, 1.0, 1.0, 1.0, 1.0, 2.0, 1.0, 3.0, …
## $ sd_hits                      <dbl> NA, NA, NA, NA, NA, NA, 0.00000, NA, NA, …
## $ sum_pageviews                <dbl> 8, 1, 1, 1, 1, 2, 2, 3, 2, 1, 2, 3, 31, 2…
## $ mean_pageviews               <dbl> 8.0, 1.0, 1.0, 1.0, 1.0, 2.0, 1.0, 3.0, 2…
## $ min_pageviews                <dbl> 8, 1, 1, 1, 1, 2, 1, 3, 2, 1, 2, 3, 31, 2…
## $ max_pageviews                <dbl> 8, 1, 1, 1, 1, 2, 1, 3, 2, 1, 2, 3, 31, 2…
## $ median_pageviews             <dbl> 8.0, 1.0, 1.0, 1.0, 1.0, 2.0, 1.0, 3.0, 2…
## $ sd_pageviews                 <dbl> NA, NA, NA, NA, NA, NA, 0.00000, NA, NA, …
## $ bounce_sessions              <dbl> 0, 1, 1, 1, 1, 0, 2, 0, 0, 1, 0, 0, 0, 0,…
## $ session_cnt                  <dbl> 1, 1, 1, 1, 1, 1, 2, 1, 1, 1, 1, 1, 1, 1,…
## $ totalTransactionRevenue      <dbl> 0, 0, 0, 0, 0, 0, 0, 0, 0, 0, 0, 0, 0, 97…
## $ transactions                 <dbl> 0, 0, 0, 0, 0, 0, 0, 0, 0, 0, 0, 0, 0, 1,…
## $ comprou                      <chr> "não", "não", "não", "não", "não", "não",…
ga |>
  count(comprou)
## # A tibble: 2 × 2
##   comprou       n
##   <chr>     <int>
## 1 não     1058330
## 2 sim        2948
Train and test data
ga_initial_split = make_splits(
  x = list(
    analysis = which(!as.character(ga$month) %in% c("2018-01-01", "2018-02-01")),
    assessment = which(as.character(ga$month) %in% c("2018-01-01", "2018-02-01"))
  ),
  data = ga
)

ga_train = training(ga_initial_split)
ga_valid = testing(ga_initial_split)
Resample
ga_resamples = sliding_period(ga_train, index = month, period = "month",
                               lookback = 5, step=2)
Exploratory analysis
Smikr
skimr::skim(ga_train)
## Warning in inline_hist(min_pageviews, 5): Variable contains Inf or -Inf value(s)
## that were converted to NA.
## Warning in inline_hist(max_pageviews, 5): Variable contains Inf or -Inf value(s)
## that were converted to NA.
Table: Table 1: Data summary
| Name | ga_train |
| Number of rows | 930624 |
| Number of columns | 38 |
| _______________________ | |
| Column type frequency: | |
| character | 15 |
| Date | 1 |
| numeric | 22 |
| ________________________ | |
| Group variables | None |
Variable type: character
| skim_variable | n_missing | complete_rate | min | max | empty | n_unique | whitespace |
|---|---|---|---|---|---|---|---|
| fullVisitorId | 0 | 1 | 14 | 20 | 0 | 885756 | 0 |
| last_channel_grouping | 0 | 1 | 6 | 14 | 0 | 8 | 0 |
| last_browser | 0 | 1 | 1 | 26 | 0 | 64 | 0 |
| last_deviceCategory | 0 | 1 | 6 | 7 | 0 | 3 | 0 |
| last_continent | 0 | 1 | 4 | 9 | 0 | 6 | 0 |
| last_operatingSystem | 0 | 1 | 3 | 16 | 0 | 22 | 0 |
| last_subContinent | 0 | 1 | 9 | 18 | 0 | 23 | 0 |
| last_country | 0 | 1 | 4 | 24 | 0 | 226 | 0 |
| last_region | 0 | 1 | 4 | 33 | 0 | 402 | 0 |
| last_metro | 0 | 1 | 6 | 55 | 0 | 99 | 0 |
| last_city | 0 | 1 | 3 | 33 | 0 | 745 | 0 |
| last_networkDomain | 0 | 1 | 2 | 64 | 0 | 32301 | 0 |
| last_source | 0 | 1 | 3 | 31 | 0 | 293 | 0 |
| last_medium | 0 | 1 | 3 | 9 | 0 | 7 | 0 |
| comprou | 0 | 1 | 3 | 3 | 0 | 2 | 0 |
Variable type: Date
| skim_variable | n_missing | complete_rate | min | max | median | n_unique |
|---|---|---|---|---|---|---|
| month | 0 | 1 | 2016-09-01 | 2017-12-01 | 2017-04-01 | 16 |
Variable type: numeric
| skim_variable | n_missing | complete_rate | mean | sd | p0 | p25 | p50 | p75 | p100 | hist |
|---|---|---|---|---|---|---|---|---|---|---|
| last_ses_from_the_period_end | 0 | 1.00 | 13.70 | 7.84 | 1 | 7.00 | 14.00 | 20.00 | 2.700000e+01 | ▇▆▆▆▇ |
| interval_dates | 0 | 1.00 | 0.47 | 2.34 | 0 | 0.00 | 0.00 | 0.00 | 2.600000e+01 | ▇▁▁▁▁ |
| unique_date_num | 0 | 1.00 | 1.11 | 0.52 | 1 | 1.00 | 1.00 | 1.00 | 2.600000e+01 | ▇▁▁▁▁ |
| max_visit_num | 0 | 1.00 | 1.49 | 3.41 | 1 | 1.00 | 1.00 | 1.00 | 4.080000e+02 | ▇▁▁▁▁ |
| prop_isMobile | 0 | 1.00 | 1.00 | 0.00 | 1 | 1.00 | 1.00 | 1.00 | 1.000000e+00 | ▁▁▇▁▁ |
| prop_isTrueDirect | 0 | 1.00 | 0.23 | 0.40 | 0 | 0.00 | 0.00 | 0.50 | 1.000000e+00 | ▇▁▁▁▂ |
| sum_hits | 0 | 1.00 | 5.42 | 13.45 | 1 | 1.00 | 2.00 | 4.00 | 1.541000e+03 | ▇▁▁▁▁ |
| mean_hits | 0 | 1.00 | 4.04 | 7.53 | 1 | 1.00 | 1.50 | 4.00 | 5.000000e+02 | ▇▁▁▁▁ |
| min_hits | 0 | 1.00 | 3.58 | 6.97 | 1 | 1.00 | 1.00 | 3.00 | 5.000000e+02 | ▇▁▁▁▁ |
| max_hits | 0 | 1.00 | 4.67 | 9.70 | 1 | 1.00 | 2.00 | 4.00 | 5.000000e+02 | ▇▁▁▁▁ |
| median_hits | 0 | 1.00 | 3.96 | 7.45 | 1 | 1.00 | 1.00 | 4.00 | 5.000000e+02 | ▇▁▁▁▁ |
| sd_hits | 819003 | 0.12 | 5.29 | 9.61 | 0 | 0.55 | 2.08 | 6.36 | 3.507200e+02 | ▇▁▁▁▁ |
| sum_pageviews | 0 | 1.00 | 4.54 | 10.03 | 0 | 1.00 | 2.00 | 4.00 | 1.445000e+03 | ▇▁▁▁▁ |
| mean_pageviews | 12 | 1.00 | 3.43 | 5.50 | 1 | 1.00 | 1.00 | 3.00 | 4.310000e+02 | ▇▁▁▁▁ |
| min_pageviews | 0 | 1.00 | Inf | NaN | 1 | 1.00 | 1.00 | 3.00 | Inf | ▇▁▁▁▁ |
| max_pageviews | 0 | 1.00 | -Inf | NaN | -Inf | 1.00 | 1.00 | 4.00 | 4.830000e+02 | ▇▁▁▁▁ |
| median_pageviews | 12 | 1.00 | 3.37 | 5.45 | 1 | 1.00 | 1.00 | 3.00 | 4.310000e+02 | ▇▁▁▁▁ |
| sd_pageviews | 819051 | 0.12 | 4.01 | 6.78 | 0 | 0.50 | 1.41 | 4.95 | 2.432400e+02 | ▇▁▁▁▁ |
| bounce_sessions | 0 | 1.00 | 0.62 | 0.73 | 0 | 0.00 | 1.00 | 1.00 | 6.300000e+01 | ▇▁▁▁▁ |
| session_cnt | 0 | 1.00 | 1.21 | 0.86 | 1 | 1.00 | 1.00 | 1.00 | 8.100000e+01 | ▇▁▁▁▁ |
| totalTransactionRevenue | 0 | 1.00 | 2129194.73 | 119342544.05 | 0 | 0.00 | 0.00 | 0.00 | 9.277596e+10 | ▇▁▁▁▁ |
| transactions | 0 | 1.00 | 0.01 | 0.14 | 0 | 0.00 | 0.00 | 0.00 | 1.500000e+01 | ▇▁▁▁▁ |
Correlation
ga_train |>
   select(where(is.numeric)) |>
   cor(use = "pairwise.complete.obs") |>
   corrplot::corrplot()
## Warning in cor(select(ga_train, where(is.numeric)), use =
## "pairwise.complete.obs"): the standard deviation is zero

Decision tree
Data prep
ga_dt_recipe = recipe(comprou ~ ., data = ga_train) |>
  update_role(month, new_role = "date") |>
  update_role(fullVisitorId, new_role = "id") |>
  step_rm(skip = TRUE,
          last_region,
          last_metro,
          last_city,
          last_networkDomain,
          last_source,
          last_browser
  ) |>
  themis::step_downsample(comprou, under_ratio = 10) |>
  step_novel(all_nominal_predictors()) |>
  step_zv(all_predictors()) |>
  step_other(
    last_subContinent,
    last_operatingSystem
  )
Model
ga_dt_model = decision_tree(
  cost_complexity = tune(),
  tree_depth = tune(),
  min_n = tune()
) |>
  set_mode("classification") |>
  set_engine("rpart")
Workflow
ga_dt_wf = workflow() |>
  add_model(ga_dt_model) |>
  add_recipe(ga_dt_recipe)
Tune
grid_dt = grid_random(
  cost_complexity(c(-9, -1)),
  tree_depth(range = c(5, 15)),
  min_n(range = c(20, 40)),
  size = 3
)

ga_dt_tune_grid = tune_grid(
  ga_dt_wf,
  resamples = ga_resamples,
  grid = grid_dt,
  metrics = metric_set(roc_auc),
  control = control_grid(verbose = TRUE)
)
## i Slice1: preprocessor 1/1
## ✓ Slice1: preprocessor 1/1
## i Slice1: preprocessor 1/1, model 1/3
## ✓ Slice1: preprocessor 1/1, model 1/3
## i Slice1: preprocessor 1/1, model 1/3 (predictions)
## i Slice1: preprocessor 1/1, model 2/3
## ✓ Slice1: preprocessor 1/1, model 2/3
## i Slice1: preprocessor 1/1, model 2/3 (predictions)
## i Slice1: preprocessor 1/1, model 3/3
## ✓ Slice1: preprocessor 1/1, model 3/3
## i Slice1: preprocessor 1/1, model 3/3 (predictions)
## i Slice2: preprocessor 1/1
## ✓ Slice2: preprocessor 1/1
## i Slice2: preprocessor 1/1, model 1/3
## ✓ Slice2: preprocessor 1/1, model 1/3
## i Slice2: preprocessor 1/1, model 1/3 (predictions)
## i Slice2: preprocessor 1/1, model 2/3
## ✓ Slice2: preprocessor 1/1, model 2/3
## i Slice2: preprocessor 1/1, model 2/3 (predictions)
## i Slice2: preprocessor 1/1, model 3/3
## ✓ Slice2: preprocessor 1/1, model 3/3
## i Slice2: preprocessor 1/1, model 3/3 (predictions)
## i Slice3: preprocessor 1/1
## ✓ Slice3: preprocessor 1/1
## i Slice3: preprocessor 1/1, model 1/3
## ✓ Slice3: preprocessor 1/1, model 1/3
## i Slice3: preprocessor 1/1, model 1/3 (predictions)
## i Slice3: preprocessor 1/1, model 2/3
## ✓ Slice3: preprocessor 1/1, model 2/3
## i Slice3: preprocessor 1/1, model 2/3 (predictions)
## i Slice3: preprocessor 1/1, model 3/3
## ✓ Slice3: preprocessor 1/1, model 3/3
## i Slice3: preprocessor 1/1, model 3/3 (predictions)
## i Slice4: preprocessor 1/1
## ✓ Slice4: preprocessor 1/1
## i Slice4: preprocessor 1/1, model 1/3
## ✓ Slice4: preprocessor 1/1, model 1/3
## i Slice4: preprocessor 1/1, model 1/3 (predictions)
## i Slice4: preprocessor 1/1, model 2/3
## ✓ Slice4: preprocessor 1/1, model 2/3
## i Slice4: preprocessor 1/1, model 2/3 (predictions)
## i Slice4: preprocessor 1/1, model 3/3
## ✓ Slice4: preprocessor 1/1, model 3/3
## i Slice4: preprocessor 1/1, model 3/3 (predictions)
## i Slice5: preprocessor 1/1
## ✓ Slice5: preprocessor 1/1
## i Slice5: preprocessor 1/1, model 1/3
## ✓ Slice5: preprocessor 1/1, model 1/3
## i Slice5: preprocessor 1/1, model 1/3 (predictions)
## i Slice5: preprocessor 1/1, model 2/3
## ✓ Slice5: preprocessor 1/1, model 2/3
## i Slice5: preprocessor 1/1, model 2/3 (predictions)
## i Slice5: preprocessor 1/1, model 3/3
## ✓ Slice5: preprocessor 1/1, model 3/3
## i Slice5: preprocessor 1/1, model 3/3 (predictions)
autoplot(ga_dt_tune_grid)

collect_metrics(ga_dt_tune_grid)
## # A tibble: 3 × 9
## cost_complexity tree_depth min_n .metric .estima…¹ mean n std_err .config
## <dbl> <int> <int> <chr> <chr> <dbl> <int> <dbl> <chr>
## 1 0.000000372 13 23 roc_auc binary 0.907 5 0.00320 Prepro…
## 2 0.00000360 11 34 roc_auc binary 0.915 5 0.00340 Prepro…
## 3 0.00000132 6 31 roc_auc binary 0.841 5 0.0187 Prepro…
## # … with abbreviated variable name ¹.estimator
Model performance
ga_dt_best_params = select_best(ga_dt_tune_grid, "roc_auc")
ga_dt_wf = ga_dt_wf |> finalize_workflow(ga_dt_best_params)
ga_dt_last_fit = last_fit(ga_dt_wf, ga_initial_split)


ga_test_preds = collect_predictions(ga_dt_last_fit) |> mutate(modelo = "dt")
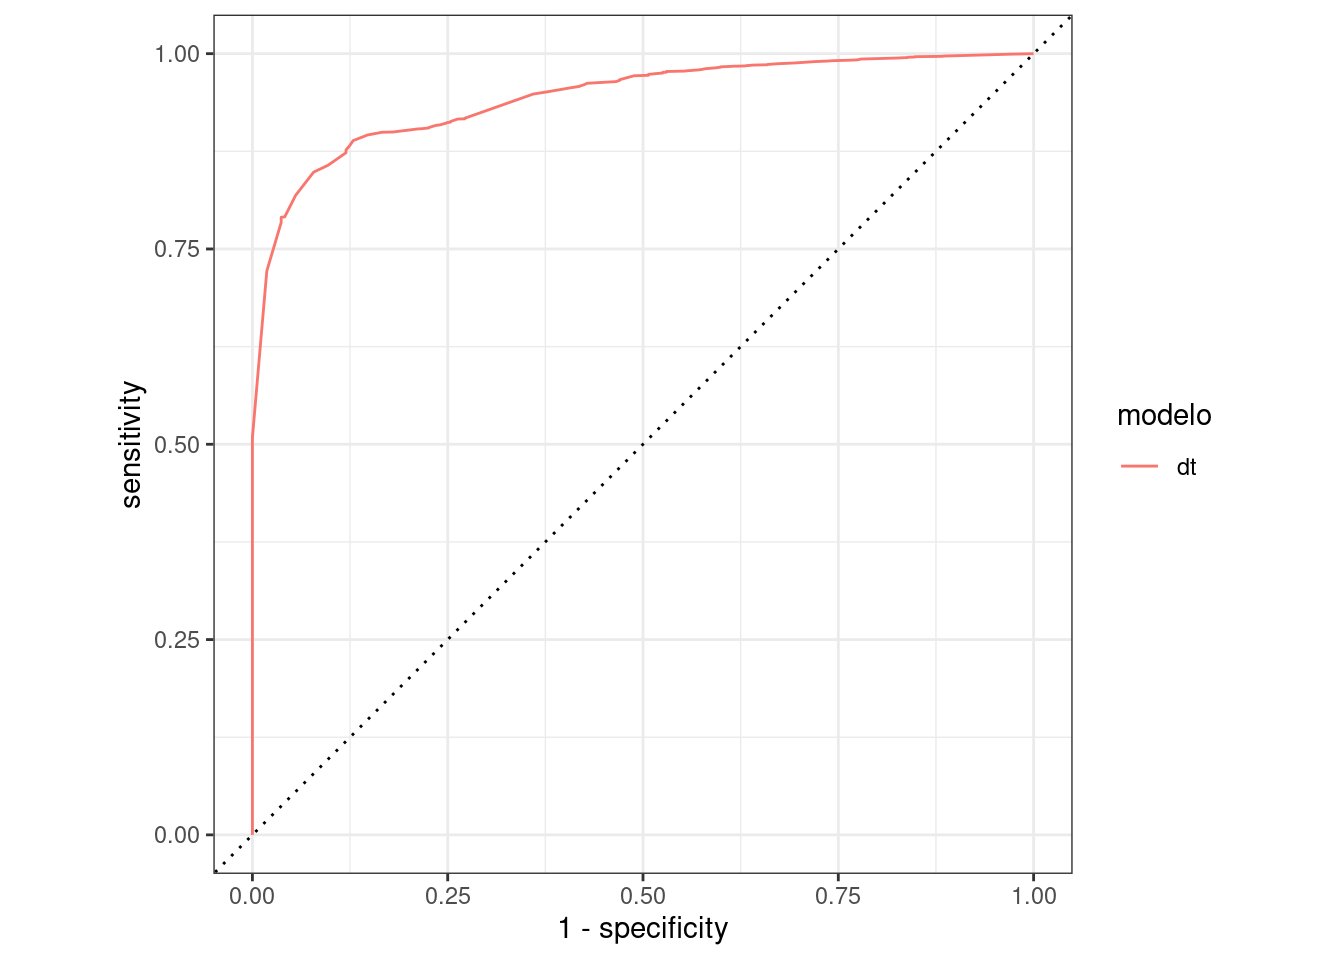
ROC AUC
ga_test_preds |>
  group_by(modelo) |>
  roc_curve(comprou, `.pred_não`) |>
  autoplot()
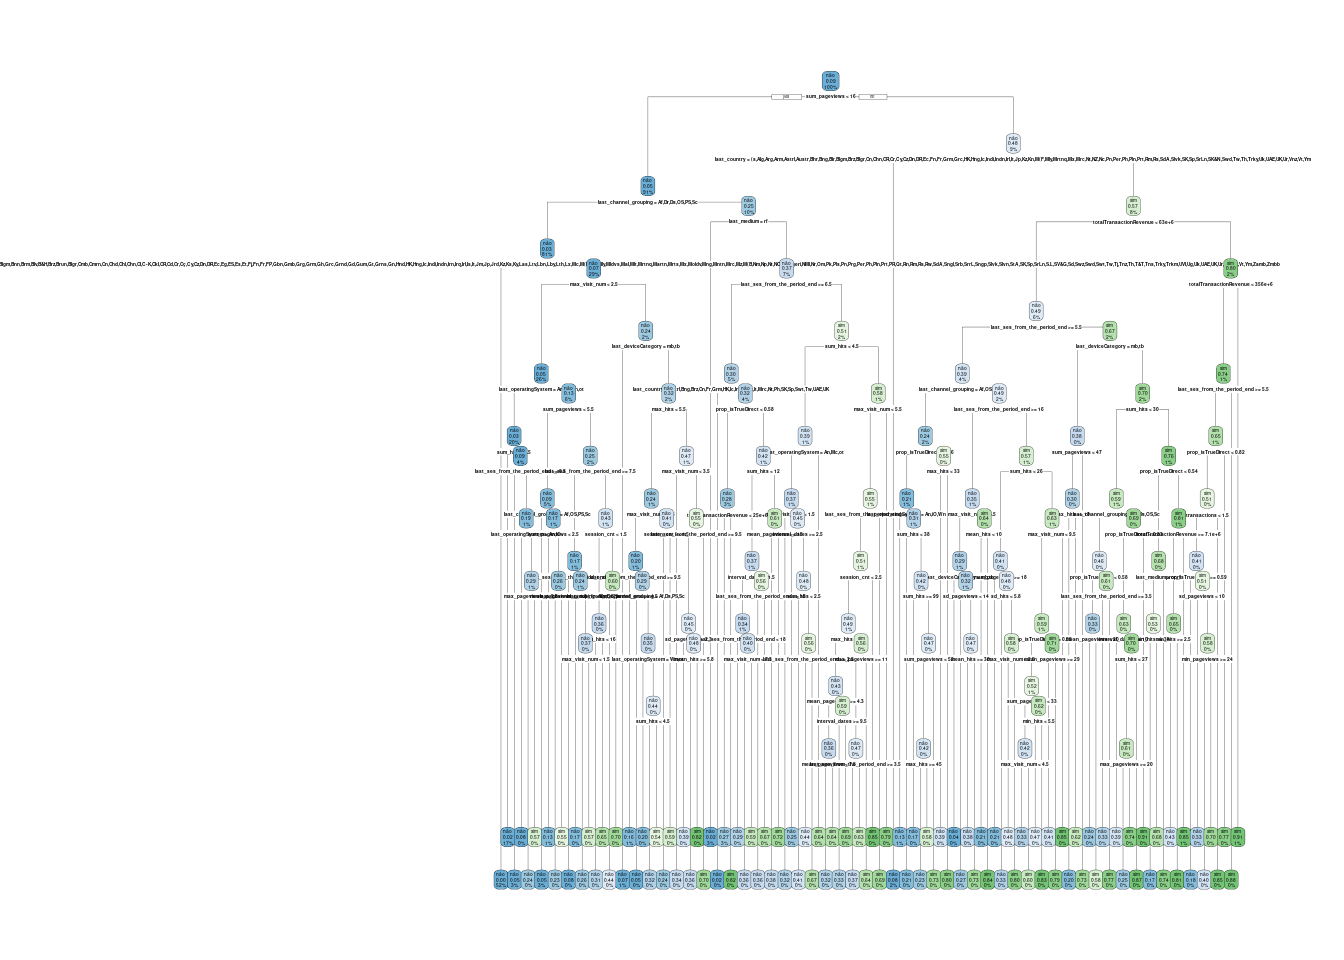
Variable importance
ga_dt_last_fit_model = ga_dt_last_fit$.workflow[[1]]$fit$fit
vip(ga_dt_last_fit_model)

rpart.plot(ga_dt_last_fit_model$fit, faclen = 2)
## Warning: Cannot retrieve the data used to build the model (so cannot determine roundint and is.binary for the variables).
## To silence this warning:
##     Call rpart.plot with roundint=FALSE,
##     or rebuild the rpart model with model=TRUE.
## Warning in abbreviate(names, minlen): abbreviate used with non-ASCII chars

## Warning in abbreviate(names, minlen): abbreviate used with non-ASCII chars

## Warning in abbreviate(names, minlen): abbreviate used with non-ASCII chars
## Warning: labs do not fit even at cex 0.15, there may be some overplotting
Final Model
ga_final_dt_model = ga_dt_wf |>
  fit(ga)
Submission file
ga_test = readr::read_csv("data/ga_test.csv")
## Rows: 133534 Columns: 37
## ── Column specification ────────────────────────────────────────────────────────
## Delimiter: ","
## chr  (14): fullVisitorId, last_channel_grouping, last_browser, last_deviceCa...
## dbl  (22): last_ses_from_the_period_end, interval_dates, unique_date_num, ma...
## date  (1): month
##
## ℹ Use `spec()` to retrieve the full column specification for this data.
## ℹ Specify the column types or set `show_col_types = FALSE` to quiet this message.
ga_submission = ga_test %>%
  mutate(
    target = predict(ga_final_dt_model, new_data = . , type = "prob")$.pred_sim
  )

ga_submission |>
  mutate(fullVisitorId = paste(fullVisitorId, month, sep = "-")) |>
  select(fullVisitorId, comprou = target) |>
  write_csv("ga_submission.csv")
License

Content is available under the Creative CommonsAttribution-ShareAlike (CC BY-SA) license. You can share and adapt it, but you must attribute the credits to the authors, adding a link to the original content. , and your sharing must also have this same type of license.
More info: Creative Commons
- Posted on:
- 24/8/2022
- Length:
- 11 minute read, 2171 words
- See Also: