Anitta- Spotify Top 1
By Tainá Rocha
26/3/2022
Hi, I'm the here-bot cat!
Use me to find your way in your website.
- Here I am:
- content/blog/anitta_spotify_1/index.markdown
- Here is my R Markdown source file:
- blog/anitta_spotify_1/index.Rmarkdown
You'll want to edit this file, then re-knit to see the changes take effect in your site preview.
To remove me, delete this line inside that file: {{< here >}}
- My content section is:
- blog
- My layout is:
- single
- Images in this page bundle:
- /blog/anitta_spotify_1/featured.jpg
- /blog/anitta_spotify_1/index_files/figure-html/fig-1.png
- /blog/anitta_spotify_1/index_files/figure-html/unnamed-chunk-2-1.png
- /blog/anitta_spotify_1/index_files/figure-html/unnamed-chunk-3-1.png
Welcome to the first blog section post!
Last week was marked by an important event, especially for the Brazilian artistic community, but also for the whole of Brazil! The Anitta singer reached the first position on Spotify with "Envolver" track music, one of the most popular worldwide audio streaming platforms! Anitta is the first Latin Womann and Brazilian to reach this position in Spotify's global ranking.
Therefore, in this post, I decided to explore very basic way (for now) tools for analyzing musical data using R, to identify the popularity trajectory of Anitta's songs over time, and what factors may be related to the popularity (but don't forget: correlation is not causality).
This analysis was only possible because this data is available by Spotify for developers, Spotify’s API, where we can request the data and so receive them through JSON metadata with the artist data, album tracks, directly from Spotify Data Catalog. You can also get user data such as playlists and songs that the user saves in the library. In future posts, in the tutorials section, I plan to do a step-by-step on how to create an account in Spotify for developers and generate the credentials. And also another complete tutorial on how to do these analyzes through R.
Analyzing Spotify’s “This Is Aniita” Playlist
The following table summarizes some popularity score statistics (0 to 100) that help us qualify the variation pattern.
## # A tibble: 1 × 4
##   Média Mediana `Desvio Padrão` `Coeficiente de Variação`
##   <dbl>   <dbl>           <dbl>                     <dbl>
## 1  51.1    52.5            13.3                     0.260
Since the popularity score ranges from 0 to 100, the average reveals good popularity above 50 (57.5).
Let’s see the score in a histogram chart
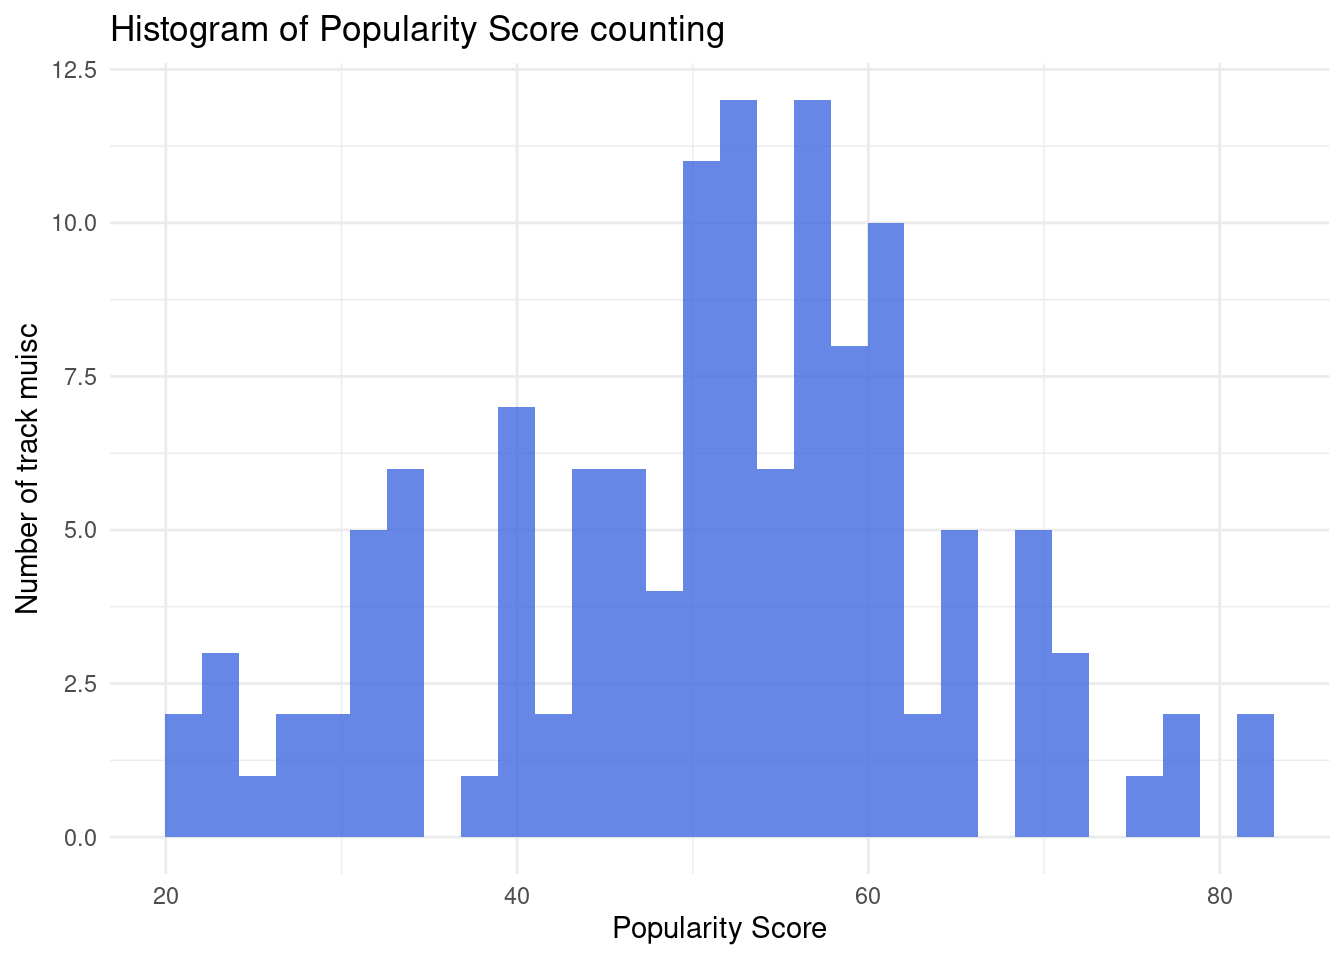
Figure 1: Histogram of Popularity Score counting
The histogram reveals more details than the mean. Most songs have a popularity score in the 60s. Few songs (from 0 to 4) scored 0 and less than 4 songs score in the 90s.
Most popular songs currently
Considering a score greater than 80
| Música | Popularidade |
|---|---|
| Envolver | 83 |
| La Loto | 82 |
Popularity of songs over the years
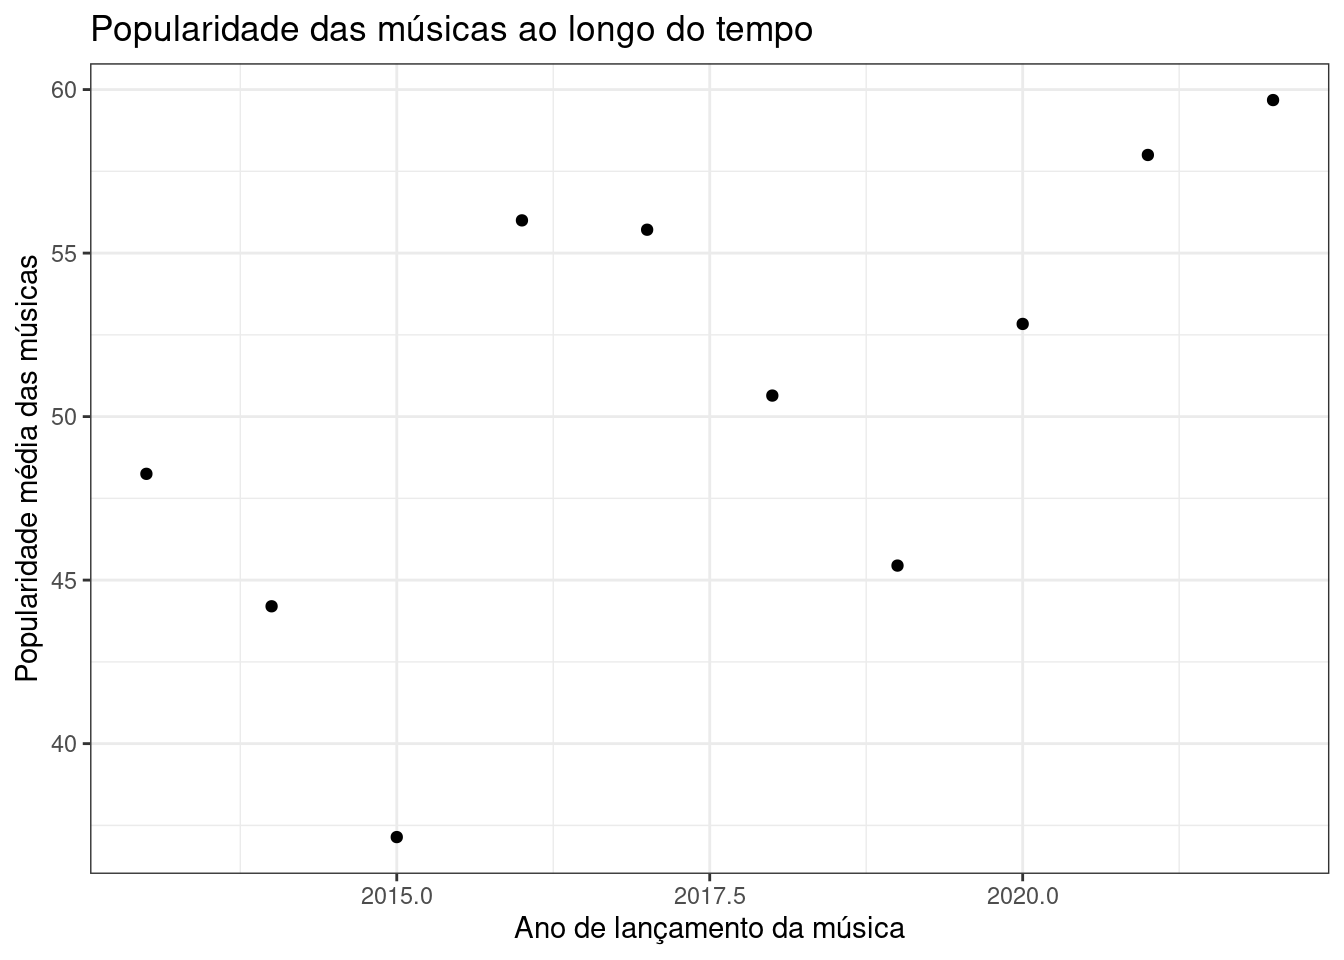
Figure 2. Popularity score x time (years)
The overall popularity score increased over time. However, between 2015 and 2016 some songs hit the score in the 60s, followed by a drop and rising again after 2017.
Relationships among factors such as:
Speed (speechiness), acoustic music (acousticness), and others. Ranging from -1 to 1, where at 0 there are no evident correlations and at -1 or 1 there are correlations. Always good to remember that: correlation does not imply causality. 😊

Figure 3. Variables correlation
The popularity score does not show strong correlations with the other variables.
So let’s go to music?
License

Content is available under the Creative CommonsAttribution-ShareAlike (CC BY-SA) license. You can share and adapt it, but you must attribute the credits to the authors, adding a link to the original content. , and your sharing must also have this same type of license.
More info: Creative Commons
- Posted on:
- 26/3/2022
- Length:
- 3 minute read, 524 words
- See Also: